


On Tuesday, the U.S. Department of Education’s Office for Civil Rights (OCR) released their 2015-2016 Civil Rights Data Collection (CRDC) report. The government agency has been collecting data on the demographics of K-12 schools in the U.S. since 1968. It has generally been their practice to publish it every two years. The latest release provides, among other things, insight into the current demographic breakdown of STEM courses.
If equality—or at least equity—is a goal of U.S. schools, then one would hope that demographic breakdown in each class would match that of the school and the country at large. It’s unreasonable, of course, for that reality to come to fruition exactly. But still, one would hope to be close.
In the 2015-2016 school year, the racial distribution of students in order of size was the following: 49% White, 26% Hispanic or Latino, 15% Black or African American, 5% Asian, 1% American Indian or Alaskan Native, 3% two or more races, and 0.4% Native Hawaiian or Pacific Islander.
51% of students were male, 49% were female. The study did not provide alternative gender options.
Algebra I: The Gateway to STEM Courses
In STEM courses, white students for the most part were overrepresented. The CRDC looks at many different data points, but they have determined that Algebra I is one of the most important. As the authors write, “Algebra is often referred to as a “gatekeeper course” because it is generally considered a prerequisite for higher-level mathematics courses. Early passage of this foundational mathematics course helps prepare students for subsequent STEM coursework.”
 But deciphering demographic data on Algebra I courses isn’t as easy as one might think. Depending on what school a given student goes to, he or she might have access to an Algebra course beginning at 7th grade. Some students, however, can’t take one till 9th grade. A significant number of high school students don’t take an algebra course until 11th or 12th grade. In other words, taking one’s first Algebra course is as much about progress in school as it is about access, full stop.
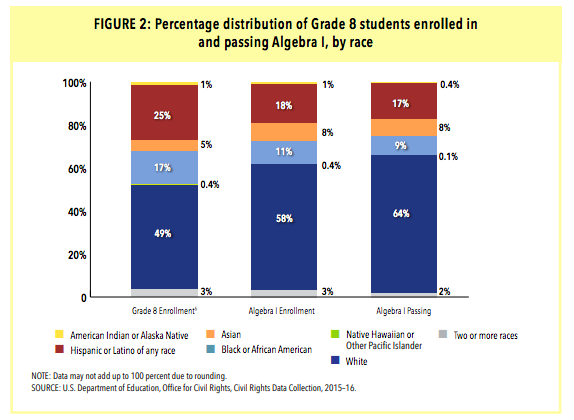
According to the authors, “For the 2015–16 school year, the CRDC collected data indicating that nearly 30,000 public schools in the United States served students who were enrolled in either Grade 7 or Grade 8. Of the schools with Grade 7 students enrolled, approximately 21 percent offered Algebra I classes. Of the schools with Grade 8 students enrolled, approximately 58 percent offered Algebra I.”
White students largely populated these traditionally middle school grades. Of those taking Algebra in 8th grade, 58% were white (a full 9% above their overall representation). Of those passing their Algebra course, the gap was even wider at 64%.
In grades 9-12, that is somewhat maintained. 58% of students taking Calculus are white—the same majority as Algebra I in 8th grade. What’s more, in Calculus classes, the number of Black and Hispanic and Latino students decreases while Asian students gain ground compared to Algebra in 8th grade.
There’s More than Just a Silver Lining
But that is easily the biggest disparity. In other STEM courses, the demographic percentages nearly follow the overall American student population. In Biology, Physics, Chemistry, and Geometry, the proportion of students only deviates by roughly 3% at most.
There is, furthermore, a more optimistic side of the report. When it comes to the breakdown of gender, no significant disparities exist. In terms of total enrollment, male students make up 51% of high school students while 49% are female (again, no alternative gender identification was allowed). Among STEM subjects, the biggest disparity lay in Physics, where 54% of students were male and 46% were female. This suggests, at least, that forces that push women away from STEM-related careers aren’t necessarily fully at work in high school.
To learn more, such as the demographic information of English learners and students with disabilities, read the full report here.


One Comment